Examining the Hull-House Settlement House maps
A blog post by M. L.
Streets adorned with refuse and horse manure. Fruit salesman along the sidewalk call out in Russian, Yiddish, Italian, and many other languages. An uncountable stream of children weave in and out of alleys. As the 19th century came to a close, this was the scene that Jane Addams and the residents of Hull-House saw just outside their doorstep and wrote about in their 1895 book, Hull-House Maps and Papers.[1]
Hull-House Maps and Papers was an examination of the contemporary conditions of the Hull-House neighborhood just east of the large settlement house where Hull-House residents served as social workers to the largely poor and immigrant community just outside their doors. The Chicago of this time was one going through great change: after the Great Chicago Fire just under 30 years ago, the city went through a period of explosive growth.[2] Between 1880 and 1890, Chicago more than doubled its population from 503,000 inhabitants to over a million.[3] On the Near West Side where the Hull-House was located, this meant that thousands of newly arrived Chicagoans moved into crowded tenements located near industrial districts along the Chicago River.[4]

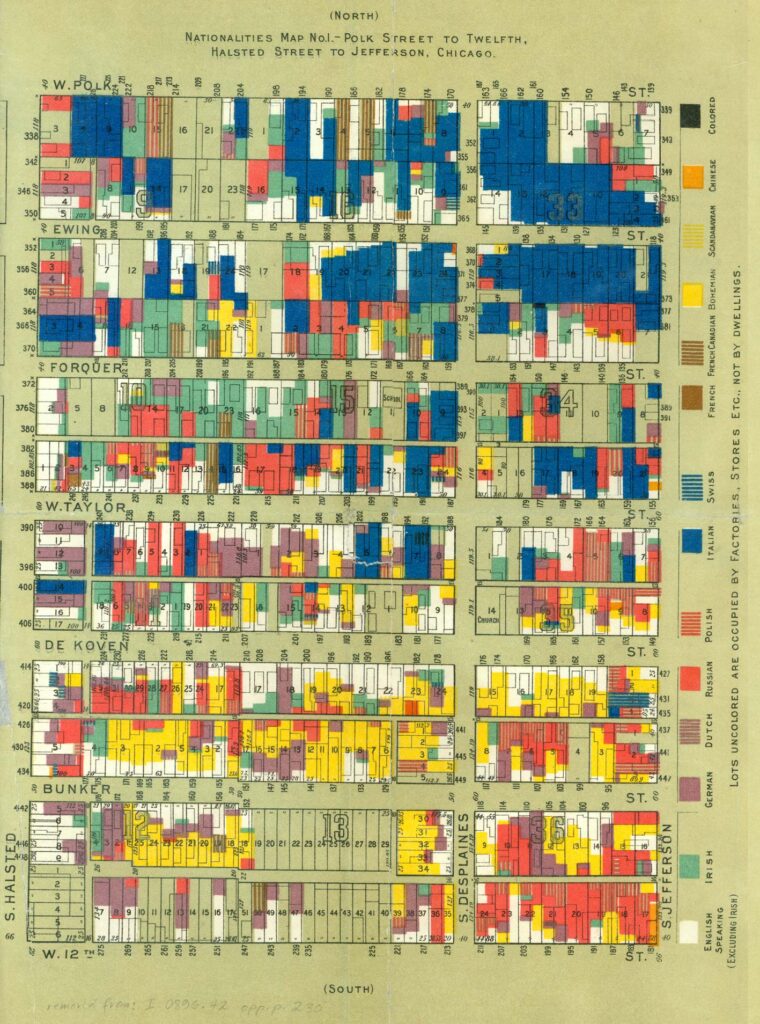
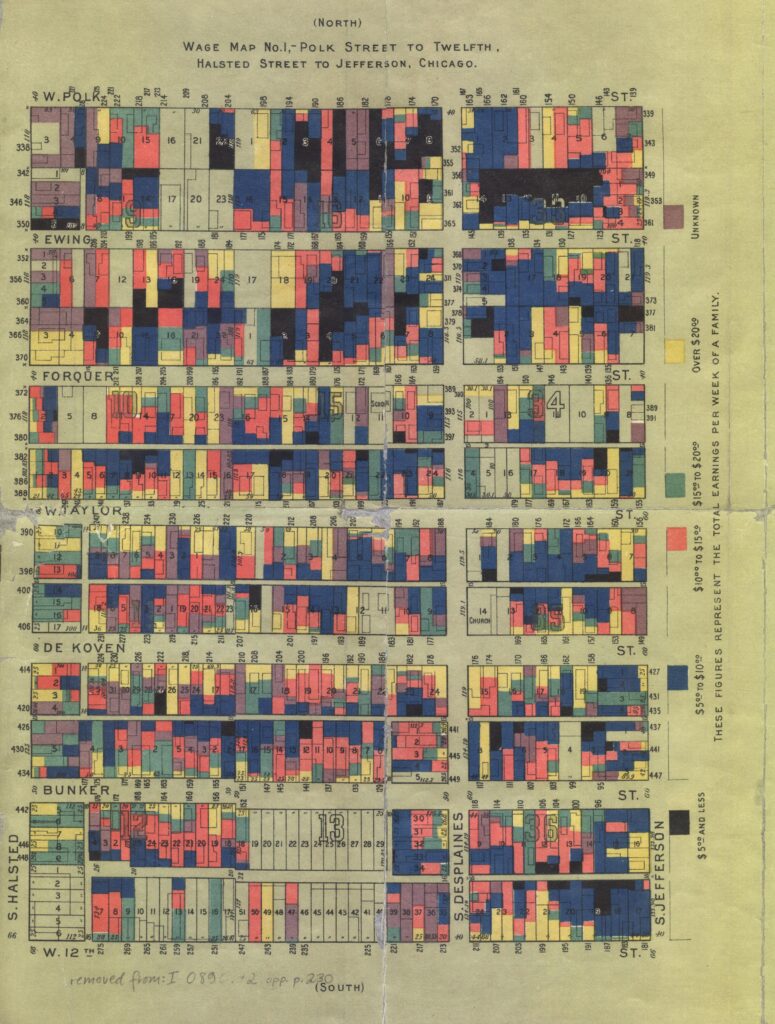
The Hull-House maps give us an insight into a piece of Chicago history that, because of the construction of the I-90 Expressway and the University of Illinois Chicago (UIC), no longer exists. These maps are color-coded to show either the nationalities or the weekly wage of the residents that lived in each building. For buildings with multiple families, buildings are colored multiple colors in a way to roughly show the ratio of individuals (for the nationalities map) or families (for the wage map) located in the building. Buildings that are colored entirely one color mean that the building is entirely inhabited by either one nationality or all residents make the same weekly wage. Notably, these maps do not give any clue to how many families or individuals live in each building, so a building colored entirely blue could be either a single Italian family of 4 or over 50 people all of Italian descent.[5]
Despite these drawbacks, it’s still interesting to see what kinds of people lived in a place you can no longer visit. In the nationalities map, you can see that while Italians seemed to congregate in the northern half of the district and Bohemians tended to stay in the southern half of the district, the neighborhood did not appear to be at all segregated by nationality. People of all nationalities lived among each other, which is especially striking in a city that is known for segregation today.

The income map of the same location is also interesting to see. While we can’t tell how many people lived in this area, we can glean some insights from what the residents were like, especially when the ethnicity map is taken into account. For example, 204 W. Polk Street had residents of Italian, Irish, English, German, and Polish descent. These families must have been very poor, as the majority of the residents made less than $5/week which would be the equivalent of $187/week today. On the other hand, there seemed to be more wealth along the streets of De Koven and Taylor Street, as many residents made over $20/week ($751/week today).[6] Still, like the nationalities map, incomes are generally spread out and there is no one area that is especially poor or especially wealthy. Both these maps suggest somewhat of the same thing: that the area just east of Halsted between Polk and Roosevelt had a wide variety of people from all sorts of backgrounds and incomes.
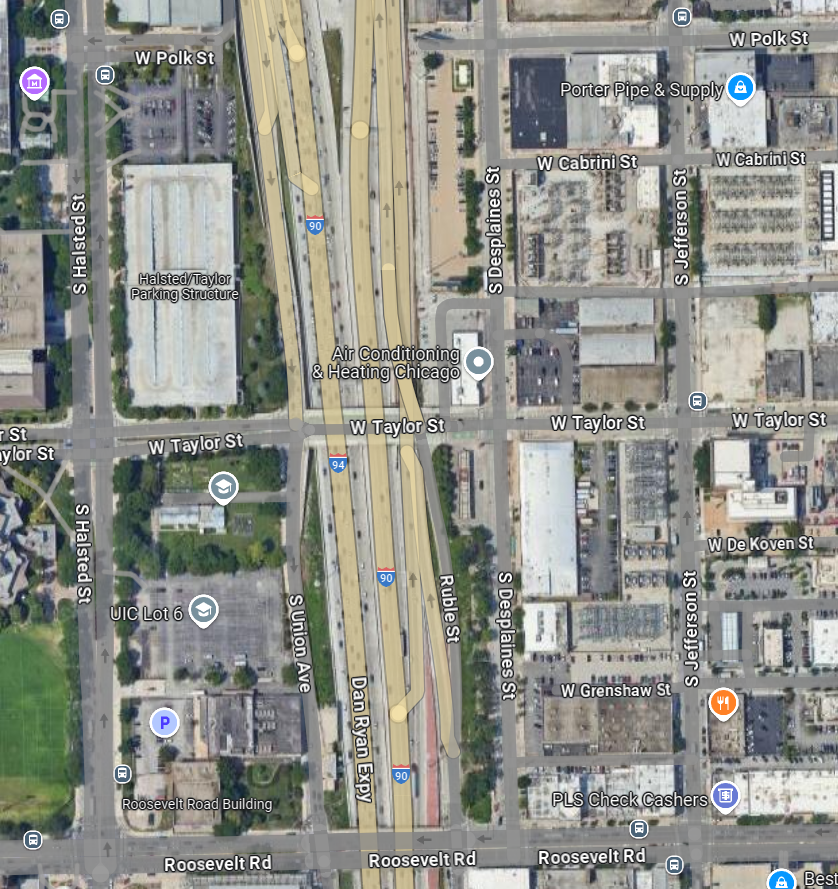
Today, this area looks nothing like the neighborhood the Hull-House papers examined. In fact, you would be forgiven for not knowing that a residential neighborhood ever existed in this part of Chicago. Both UIC and the I-90 expressway have fundamentally changed the urban fabric of this neighborhood.

The Dan Ryan Expressway opened in 1962 and UIC (then known as the University of Illinois at Chicago Circle) came a few years later in 1965.[7][8] Today, what used to be the homes and businesses of thousands are now mostly parking, roads, and small industrial buildings.
Interestingly, Census maps suggest that this area still continues to be somewhat diverse despite its low density: an interactive segregation map on WTTW says that the same area the Hull-House maps above covered is 33% white, 16% Latino, 16% Asian, and 16% black.
Still, it’s hard not to feel sad about what the Hull-House neighborhood could have been if it were not for the urban renewal of the mid-20th century. The WTTW segregation map shows this quite clearly: east of Halsted lost most of its population after 1950, and the UIC area lost most of its population after 1960. While it’s doubtful that the Hull-House area will ever become a residential community again, knowing what was once here can help us better understand the history and diversity of the Near West Side.
[1] Residents of Hull-House. Hull-House Maps and Papers. New York: Thomas Y. Crowell & Co., 1895.
[2] Sawislak, Karen. “Fire of 1871.” Encyclopedia of Chicago. 2005. http://www.encyclopedia.chicagohistory.org/pages/1740.html
[3] Nugent, Walter. “Demography – Chicago as a Modern World City.” Encyclopedia of Chicago. 2005. http://www.encyclopedia.chicagohistory.org/pages/962.html
[4] Harr, Sharon. “Chapter 4: Classrooms off the Expressway: A New Mission for Higher Education.” in The City as Campus Urbanism and Higher Education in Chicago, 60. Minneapolis: University of Minnesota Press, 2011.
[5] Residents of Hull-House. Hull-House Maps and Papers. New York: Thomas Y. Crowell & Co., 1895.
[6] “Inflation Calculator.” In 2013 Dollars. Accessed December 1, 2024. https://www.in2013dollars.com/us/inflation/1895
[7] McClendon, Dennis. “Expressways.” Encyclopedia of Chicago. 2005. http://www.encyclopedia.chicagohistory.org/pages/440.html
[8] “History.” UIC. Accessed December 1, 2024. https://www.uic.edu/about/history/